Having trouble finding the tops and bottoms on the chart? You’re not alone. Indicators are often confusing and experience is what makes the difference. Luckily for us David is here with another take on oscillators and how to bypass some of the false signals they provide and even more crucially – how to find stronger setups.
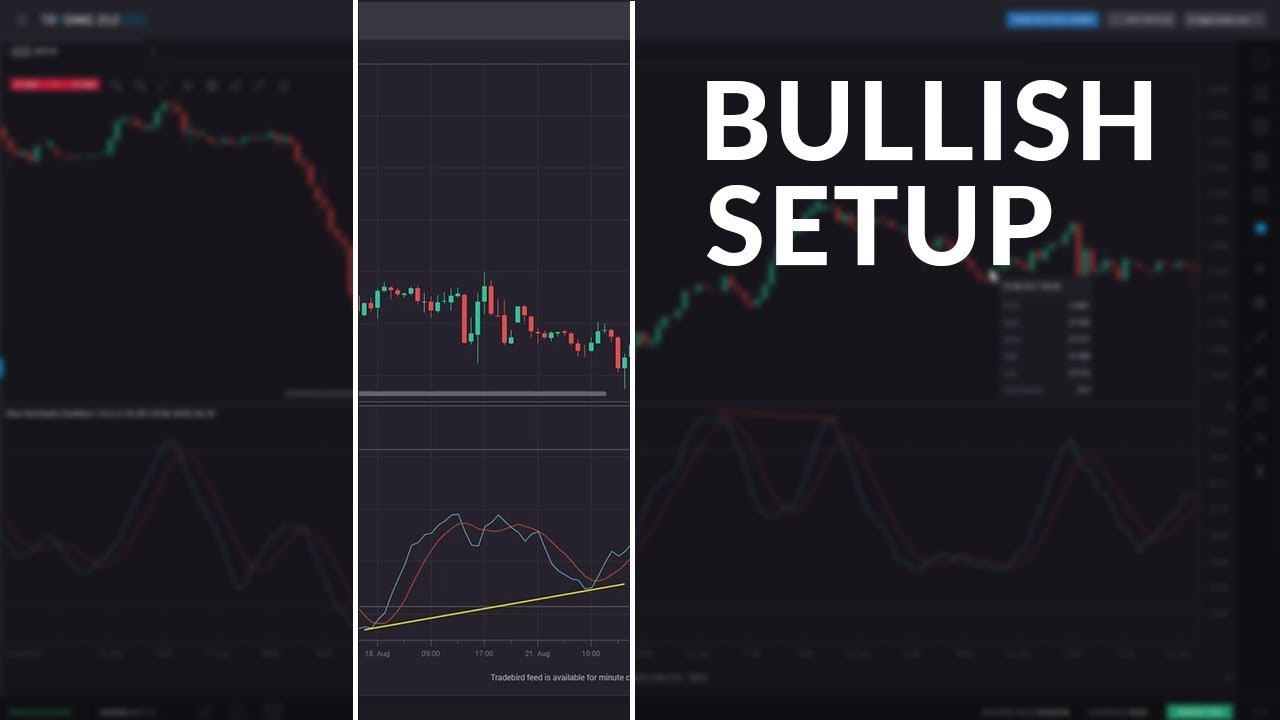
We go over bullish and bearish divergences both in theory and in several real trading examples from recent weeks. Naturally the textbook description of how they should work is rarely as simple in real-life but David navigates us towards the best interpretation of indicators like slow stochastic and the RSI.
We go over bullish and bearish divergences both in theory and in several real trading examples from recent weeks. Naturally the textbook description of how they should work is rarely as simple in real-life but David navigates us towards the best interpretation of indicators like slow stochastic and the RSI.
At Trading 212 we provide an execution only service. This video should not be construed as investment advice. Investments can fall and rise. Capital at risk. CFDs are higher risk because of leverage.